Innocent Gininda shares his journey to becoming a registered Professional Engineer (PrEng), emphasizing the importance of mentorship, early preparation, and understanding ECSA requirements. He offers advice to aspiring PrEngs, highlighting the value of diverse feedback and a positive mindset. My journey to becoming a registered Professional Engineer (PrEng) culminated successfully in November 2024. I was fortunate to begin my career at a company with a Commitment and Undertaking (C&U) Agreement with ECSA and a robust mentorship program. This commitment to training engineers to the standard required for Professional Registration provided me with essential resources and a structured path to track my experience against ECSA requirements. Early exposure to these expectations instilled a positive outlook on registration and solidified my desire to achieve this milestone. My views on Professional Registration have remained consistently positive throughout this journey. Working alongside ...
How do we know what's actually happening to construction productivity?
America is finally, FINALLY beginning to wake up to the problem of its ruinous construction costs. The next step is figuring out why those costs are high, so that eventually we can bring them down, thus ushering in a paradise of cheap housing and transportation.
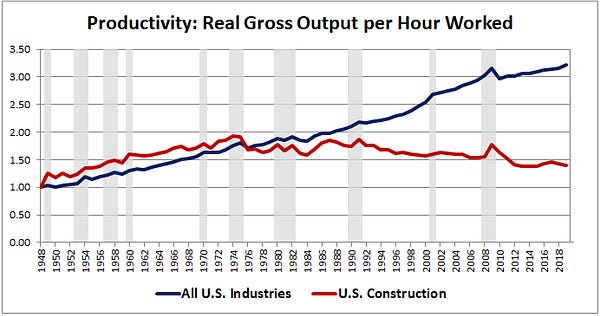
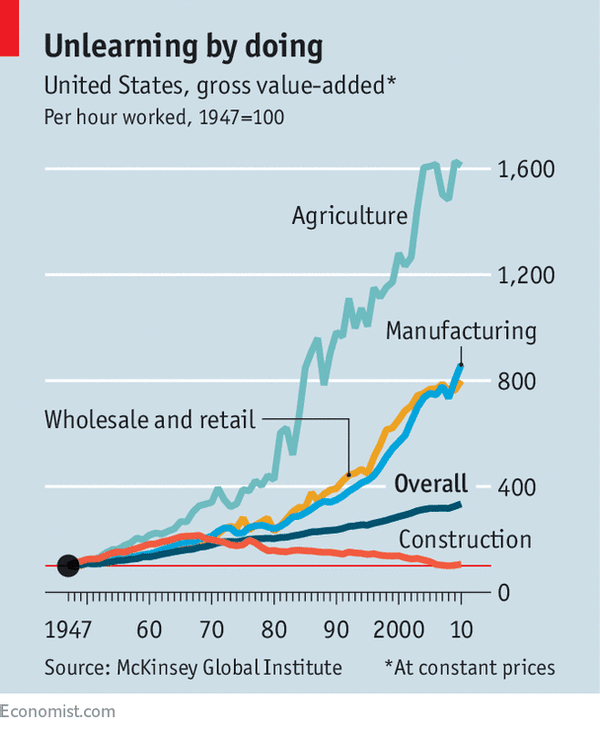
The flip side of high construction costs is low construction productivity — meaning the amount of built stuff we get for a certain number of person-hours of construction work. Various measures show an alarming long-term decline. For example, here’s real gross output per hour worked:
This is pretty dire. Productivity is supposed to improve over time, as humanity learns better and better ways to do things. If it’s declining, that means that the institutions we use to implement the construction technologies we have — things like purchasing, permitting, and regulation — are getting less efficient faster than new construction technology is being invented. In other words, social sclerosis is outrunning human ingenuity. That’s not good.
So why is construction productivity getting worse? The more I read about this question, the more I realize how complex and difficult it is. So the first post in this series is just going to be about some (not even all!) of the issues involved in measuring construction productivity.
Prices and hours are hard to measure
To compare productivity over time, you do three things. First, you calculate the total amount of output, measured in today’s prices. Then you adjust that output for a measure of how prices have changed over time, so that you’re holding the amount of real stuff constant. Then you divide by the number of hours that went into producing that output in each time period.
The first step — calculating the total number of dollars’ worth of construction output in each year — isn’t that hard. Those numbers get reported, and the definition is not particularly ambiguous. The other two, however, are much harder. When Eddy M. Rojas set out to measure construction productivity in a 2003 paper, he ended up throwing up his hands:
The main conclusion of the study is that the raw data used to calculate construction productivity values at the macroeconomic level and their further manipulation and interpretation present so many problems that the results should be deemed unreliable. The uncertainty generated in the process of computing these values is such that it cannot be determined if labor productivity has actually increased, decreased, or remained constant in the construction industry for the 1979-1998 period.
Oh dear. Perhaps this is why there’s so little published research on construction productivity! It’s hard to write about something you can’t even measure. But let’s assume Rojas is being too pessimistic here, and that measurement is difficult but possible.
First let’s talk about measuring prices. There are various measures of consumer and producer prices you can use — for example, the graphs above probably use a standard CPI or PCE measure. But a more accurate price index would probably just look at the prices within the construction industry specifically. There are also a whole lot of different ways to calculate those prices.
It’s not clear how much of a difference this makes. Most official measures of prices, both in the overall economy and in the construction industry, track each other pretty closely until maybe around 1990. But when economist Steven G. Allen looked at the decline in construction productivity from 1968 to 1978, he used a database purporting to measure the prices of completed construction projects, and he found that about half of the measured decline in productivity went away!
But Allen’s database might be wrong too. The difficulty in measuring construction-specific prices is that it’s very hard to tell whether price changes reflect underlying quality differences, or simply people paying more for the same quality. As the Bureau of Labor Statistics puts it:
The main difficulty is that buildings differ widely in their characteristics and features. Similarly, the nature of the underlying terrain varies widely among construction projects. Consequently, economists, both in general and within the BLS productivity program, have found it exceptionally difficult to develop reliable output price deflators to convert observed revenues into meaningful measures of output growth over time. Good output price deflators are therefore the key to more accurate measures of productivity growth in construction.
Over the last 15 years, the BLS has tried to calculate more accurate price indices for the construction industry, and they check their work with four different alternative indices, so we can probably trust recent numbers more than the older ones. But still, the difficulty in measuring prices is going to introduce some uncertainty into these trends.
Next, let’s talk about hours. That’s less ambiguous than prices, because you don’t have to weight the hours — you just sum up all the hours that any human being spends working on a construction project. Simple, right?
Well…no. Construction companies use subcontractors, which may or may not get counted in the hours data, and which can be hard to track down. And in the U.S. they also use lots of undocumented immigrants, whose hours they don’t report because hiring undocumented immigrants generally isn’t legal. So it’s hard to know how many hours are actually being worked here. Subcontracting and use of undocumented labor both probably increased up until 2007-8.
But anyway, this isn’t actually as huge a problem as you might think. Since most contractors charge by the project rather than by the hour, mismeasurement of hours probably leads construction productivity to be overstated rather than understated — because we’re more likely to miss hours worked rather than to measure “phantom hours” that weren’t really worked.
So hours mismeasurement is pushing measured productivity upward from the true value, and price mismeasurement could be going either way. This means that there are two possibilities:
Hours mismeasurement might partially cancel out price mismeasurement, in which case total measurement error isn’t as big of a problem as you might think, or
Hours and price mismeasurement might both lead productivity to be overstated, meaning that true productivity is even worse than the headline numbers say.
So this should lead us to be pessimistic about the construction productivity numbers we’re seeing, even though there is a chance that prices are so overstated that the actual decline is a bit less severe than what the headline numbers say.
(But also note that these measurement issues make international comparisons incredibly difficult and potentially misleading. For example, both Statista and McKinsey report that U.S. construction productivity has fallen in recent years. But while McKinsey shows China and Turkey growing their productivity substantially over 1995-2015, Statista shows both countries’ productivity shrinking over the latter half of that period. Is the difference due to the difference in time periods? Seems possible (see the later section on time periods), but a more likely explanation is that since measurement of prices and hours is difficult, measurement of these things across countries and across time is an incredibly daunting task, and these numbers should always be taken with several grains of salt.)
What we build matters
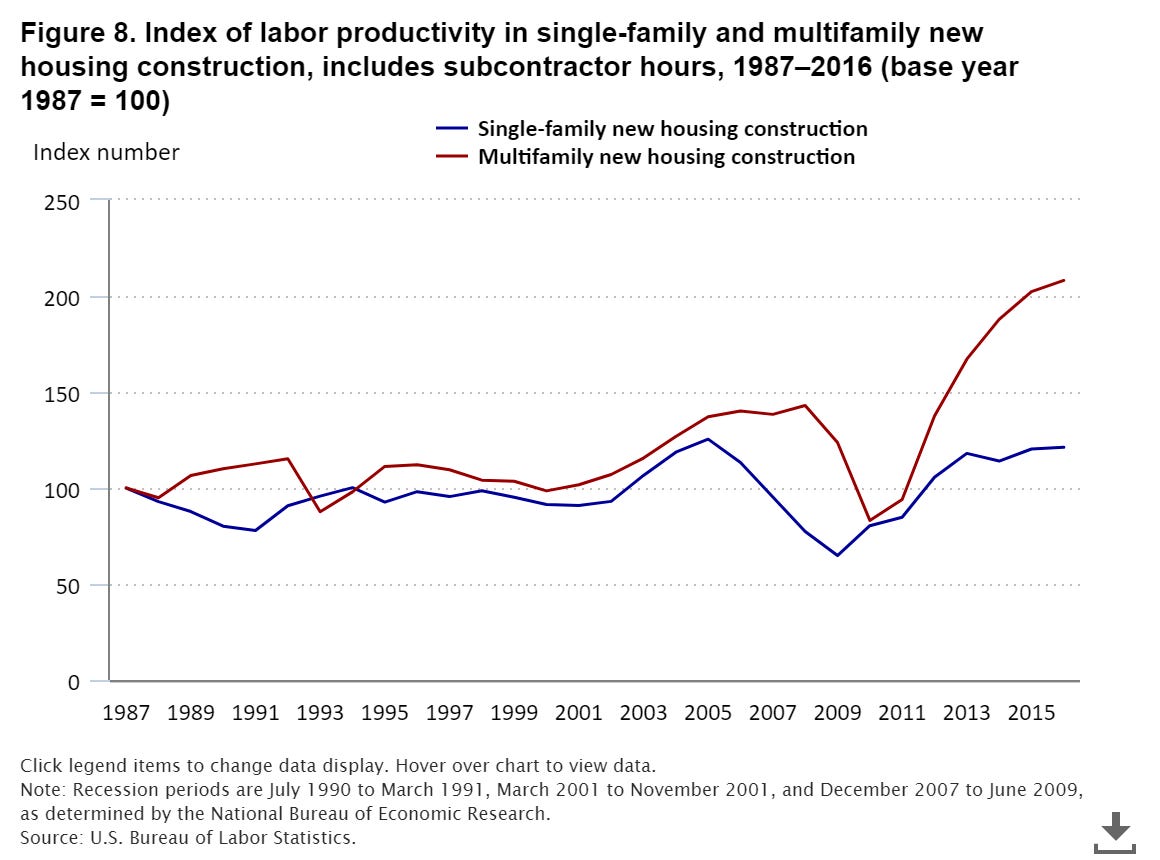
In assessing why productivity has fallen, it’s important to look at what’s actually getting built. “Construction” actually encompasses many different activities — building houses, apartment buildings, offices, factories, roads, and so on. Productivity may be increasing in some of these areas and not others. For example, the BLS finds that productivity in multifamily housing construction in 2015 was double what it was a decade ago, after remaining stagnant for a long time, while productivity in single-family housing construction has increased by only 21%:
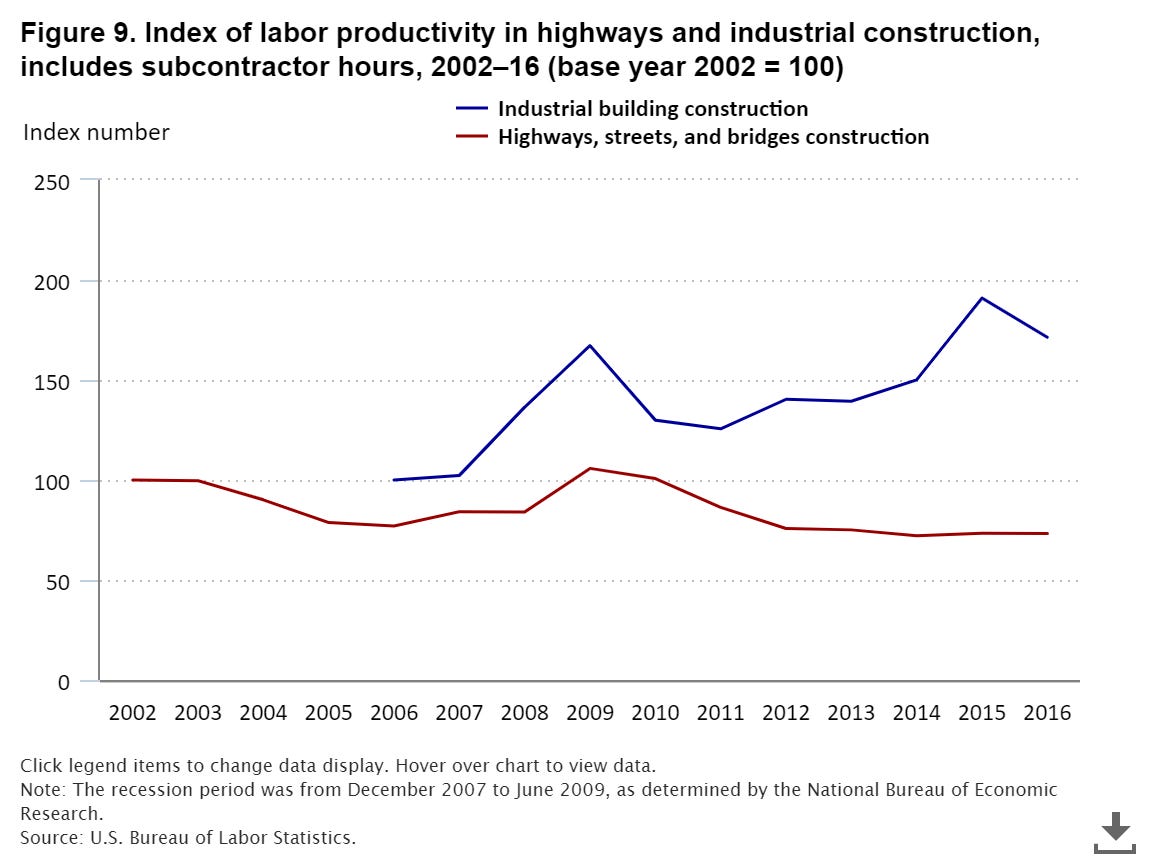
Similarly, they find that productivity in the construction of industrial buildings grew by over 70% from the mid-2000s to 2015, while road and bridge construction productivity fell by 27%!
In fact, the BLS finds that over the period from 2006-15, productivity in industrial building construction outpaced productivity growth in manufacturing!
This is important for several reasons. First of all, it’s a clue as to the importance of institutional factors — the technologies used to build single-family houses likely are different than the technologies used to build office buildings, but there are probably some similarities too. The fact that we see productivity stagnating in one of these areas and zooming upward in another means that innovations are getting created and implemented in one sector but not the other, and we need to ask why.
Second, it tells us that the mix of what we build in America matters for productivity. If we move from building multifamily housing toward building more single-family housing, and productivity gains are faster in the former than in the latter, it will tend to reduce our overall productivity growth in construction as a whole. In fact, Steven G. Allen finds that this explains a substantial portion of the construction productivity decline between 1968 and 1978:
The biggest factor in this decline was the reduction in skilled labor intensity resulting from a shift in the mix of output from largescale commercial, industrial, and institutional projects to single-family houses.
In other words, simply moving out to the ‘burbs lowered both our construction productivity and our construction productivity growth, because building single-family homes is a relatively simple, lower-skilled task, while building apartment buildings, factories, and offices is a higher-skilled task that is more amenable to technological innovation. (As for why this is true, and whether it could be changed, I’ll address that in the next post.)
Now, so far I’ve been talking about differences between construction industries. But there’s an even finer level of differentiation here — the differences between construction tasks. Various researchers have looked at how productive construction workers are at doing various specific tasks involved in the construction process (e.g. hand trenching), and found that productivity in these tasks has generally been increasing. So the fact that productivity in the aggregate is stagnant or declining means that we’re either shifting the construction process from more productive tasks to less productive tasks, or adding sources of cost that aren’t involved with the physical building of things.
The time period matters
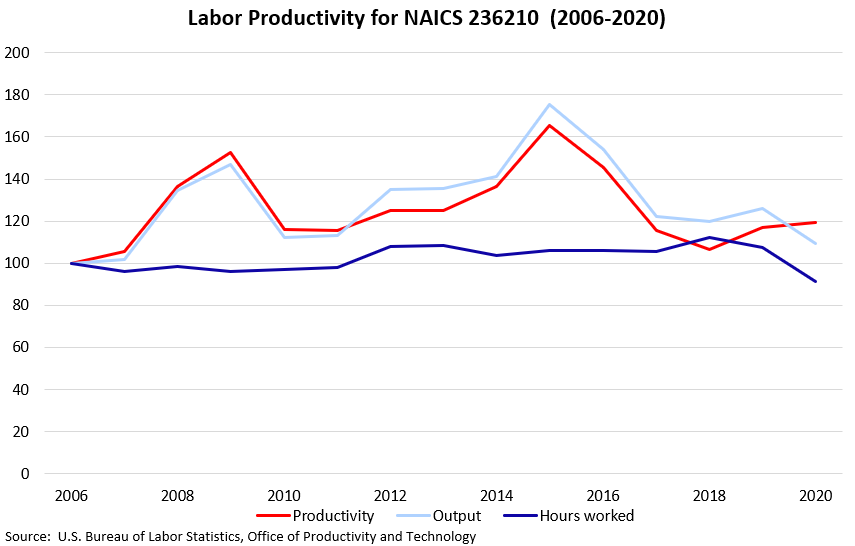
Finally, we have to think about the time period we’re looking at. The two graphs at the start of this post showed a long, slow stagnation or decline in construction productivity starting in the early 1970s. But this conceals some major ups and downs, which are more apparent when we use better price indices and more accurate measurements of hours, and when we break down construction into its component industries. For example, there are those BLS graphs showing productivity in multifamily housing and industrial buildings rising strongly since the end of the housing bubble. But when they came back and ran the numbers in 2020, the big improvements — and the big decline in road and bridge construction productivity — had largely been reversed! Here’s multifamily housing: …and here’s industrial buildings:
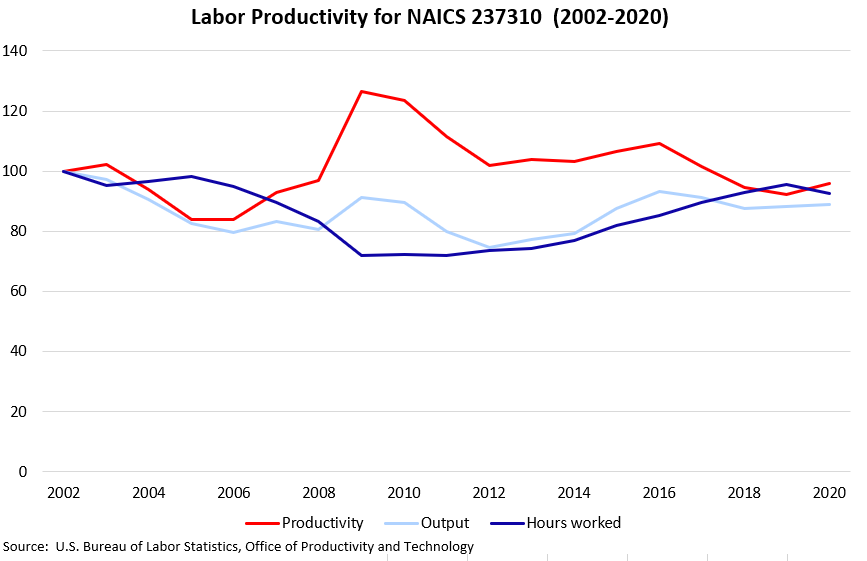
…and here’s road and bridge construction:
Why does this matter? Well, suppose we see a permanent turnaround in construction productivity. It’ll be years — or, really, decades — before we know whether it’s a blip that’s about to mean-revert, just like the big post-bubble surge in certain industries reversed in recent years. That limits the amount that aggregate statistics can tell us.
It also suggests that the aggregate statistics are getting big things wrong, even after all the heroic attempts to improve the measurements of prices and hours. Technology doesn’t improve by 70% in one decade and then regress in a few years. Even regulation is highly unlikely to move that fast. In other words, there are probably still big measurement errors in these series, which are causing these apparent swings in productivity. For example, some have suggested that one such error is the use of undocumented labor, which surges during boom periods and crashes during busts. Since these hours go unreported, this would tend to exaggerate productivity growth in a boom and productivity decline in a bust.
Until measurement is vastly improved, it’s going to be really difficult to use these aggregate data series to tell whether construction productivity growth is recovering.
The upshot: Yes, productivity is stagnant or declining
Anyway, those are some of the main problems in measuring construction productivity using these kinds of aggregate statistics. But note that none of these problems reverses the basic conclusion presented at the beginning of this post — productivity in construction has been either stagnant or negative since the early 1970s. Mismeasurement of prices might mean the decline isn’t quite as bad as advertised, and some construction industries (and many construction activities) have probably seen their productivity grow somewhat. But none of these caveats is nearly big enough to reverse the basic fact of long-term stagnation. And the under-reporting of hours by subcontractors and undocumented immigrants, together with construction productivity’s apparent tendency to mean-revert over short periods of time, only strengthens the basic conclusion.
Construction productivity is not doing well. Now it’s time to figure out why, and what can be done to improve it.


Comments
Post a Comment